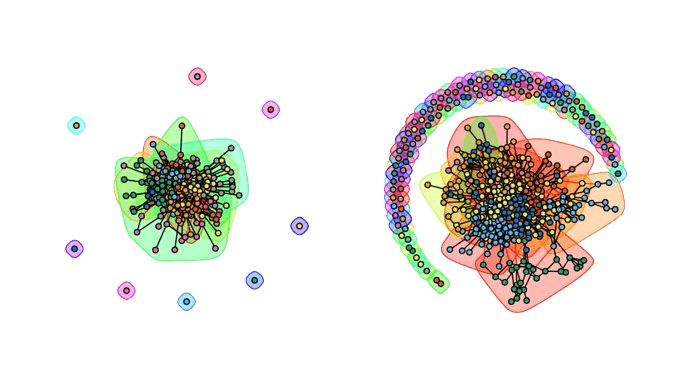
Every university claims a unique culture, and I wondered how to measure it during my freshman year of college. The social genome is the idea that the coefficients of an Exponential-Family Random Graph Model (ERGM), a statistical model that estimates the probability of observing a given network as a function of structural and attribute-based terms, fitted to a campus friendship network constitute a quantitative signature, a set of "social genes" encoding why friendships form at one institution versus another. Using the Facebook100 dataset (Traud, Mucha & Porter, 2012), a digital fossil of complete Facebook networks from 100 U.S. universities circa September 2005, I fitted a consistent ERGM specification across Caltech (762 nodes), Dartmouth (7,677 nodes), and Cornell (18,621 nodes). The resulting coefficient vectors distinguish the three institutions and, in Dartmouth's case, refute the obvious hypothesis about what drives its social structure.
I. Data
The Facebook100 dataset provides one undirected, unweighted graph per university , where nodes are students and edges are reciprocal Facebook friendships confirmed within that university's `.edu` domain. Each node carries anonymized, self-reported attributes like gender, class year, major, second major, residence (dorm/house), and high school. The `.edu` gate makes each a self-contained social system, as in, no cross-university edges exist, so structural differences across universities can be attributed to institutional characteristics instead of inter-network dependencies.
The original `.mat` files were retrieved via the Internet Archive (the dataset has been removed from the public internet for privacy reasons) and converted to CSV via `scipy.io.loadmat`. For each university, the sparse adjacency matrix was extracted and its upper triangle taken via to avoid double-counting undirected edges.
| Caltech | Dartmouth | Cornell | |
|---|---|---|---|
| 762 | 7,677 | 18,621 | |
| 16,651 | 304,065 | 790,753 | |
| Density | 0.057 | 0.010 | 0.005 |
Density is computed as .
II. The ERGM Framework
An Exponential-Family Random Graph Model defines a probability distribution over the space of all graphs on nodes. For an observed graph on node set with covariate matrix :
where is a vector of sufficient statistics computed on the graph (edge counts, homophily counts, structural terms), is the parameter vector we estimate, and is the normalizing constant summed over all possible graphs. This constant is intractable for any nontrivial , which is why estimation requires simulation.
Model Specification
The specification is held constant across all three universities:
In terms of the sufficient statistics vector , these are:
Each has a conditional log-odds interpretation: holding all else equal, if two nodes share attribute , the log-odds of a tie between them shifts by . The edges parameter captures baseline tie propensity (analogous to an intercept). A negative means ties are "costly". Most dyads are non-edges, as expected in any sparse social network.
Estimation
The normalizing constant makes direct MLE infeasible. Estimation proceeds via Monte Carlo Maximum Likelihood Estimation (MCMLE), which approximates the ratio by simulating graphs from and iteratively updating . The MCMC sampler proposes tie toggles (flipping ) and accepts via Metropolis-Hastings. Convergence is assessed by monitoring the difference between observed and simulated sufficient statistics.
All models were fit using the `ergm` package in R with `control.ergm(parallel = num_cores, parallel.type = "PSOCK", MCMLE.maxit = 100)`. A deeper Caltech model augmented with a `gwesp` (geometrically-weighted edgewise shared partners) term to capture triadic closure ran for over two days!
The `gwesp` statistic takes the form:
where counts the number of edges with exactly shared partners, and is a decay parameter controlling how quickly additional shared partners contribute diminishing returns to tie probability. This term captures the "friend of a friend" effect (triadic closure) as an endogenous structural force distinct from attribute-based homophily.
III. Exploratory Network Analysis
Before fitting ERGMs, I computed vital signs on the largest connected component of each . The adjacency matrix was symmetrized as and loaded into `igraph` with vertex attributes attached.
| Measure | Caltech | Dartmouth | Cornell |
|---|---|---|---|
| Average degree | 43.7 | 79.2 | 84.9 |
| Global clustering | 0.291 | 0.151 | 0.136 |
| Assortativity (residence) | 0.070 | 0.118 | 0.161 |
| Assortativity (major) | 0.002 | 0.044 | 0.049 |
| Modularity (Louvain) | 0.399 | 0.431 | 0.471 |
| Average path length | 2.338 | 2.768 | 2.876 |
| Diameter | 6 | 8 | 8 |
| Mean betweenness | 0.002 | 0.000 | 0.000 |
| Degree variance | 1,367.6 | 5,591.2 | 7,395.4 |
Average degree is . Global clustering is .
Caltech is dense and tightly clustered (). Cornell has the highest average degree (84.9) despite the lowest density (0.005), might be a consequence of scale, and the highest modularity (0.471) and degree variance, the signature of a "city of neighborhoods" with both hyper-connected hubs and isolated individuals. Dartmouth's clustering (0.151) is lower than expected for a school whose identity revolves around residential and Greek life, which hints that its ties may be more bridging across groups than bonding within them.
Chi-squared tests were used to assess whether Louvain-detected communities align with known attributes (residence, major), following the methodology of Traud et al. (2012). This tests the null : community membership and attribute are independent, via:
where and are observed and expected counts in the contingency table of community attribute.
IV. The Social Genomes
The social genomes revolve around three hypotheses and three coefficient vectors. Full ERGM summaries with standard errors, -values, and -values are reported below.
Caltech: "The Focused Silo"
| Term | SE | |||
|---|---|---|---|---|
| edges | 0.0125 | |||
| nodematch(year) | 0.0175 | |||
| nodematch(residence) | 0.0173 | |||
| nodematch(major) | 0.0280 | |||
| nodematch(high\_school) | 0.0771 |
This confirmed the hypothesis. Shared residence is the strongest driver (, corresponding to an odds ratio of : students in the same House are roughly six times more likely to be friends, all else equal). Shared class year follows (). Shared major is positive but modest (). The surprising result is the strong negative coefficient on shared high school (): once campus affiliations are accounted for, pre-college ties are effectively overwritten. The House system there must absorb the social world then.
Dartmouth: "The Social Bubble"
| Term | SE | |||
|---|---|---|---|---|
| edges | 0.0022 | |||
| nodematch(year) | 0.0056 | |||
| nodematch(residence) | 0.0054 | |||
| nodematch(major) | 0.0070 | |||
| nodematch(high\_school) | 0.0078 |
Hypothesis refuted! The edges coefficient () indicates ties are exceptionally costly. Every institutional attribute like residence (), major (), high school () has a negative effect on tie formation. The sole positive coefficient is nodematch(year), and its effect is negligible (, odds ratio ). This genome implies that the primary drivers of friendship at Dartmouth are not the formal categories in the dataset but unobserved social foci (specific clubs, teams, Greek houses at a finer grain than the anonymized residence codes can tell us) powerful enough to render institutional assignments statistically irrelevant.
Cornell: "The Metropolis"
| Term | SE | |||
|---|---|---|---|---|
| edges | 0.0032 | |||
| nodematch(year) | 0.0079 | |||
| nodematch(residence) | 0.0079 | |||
| nodematch(major) | 0.0138 | |||
| nodematch(high\_school) | 0.0162 |
Hypothesis confirmed, again. The most negative edges term of all three (, baseline odds of a tie: ). Every institutional attribute except class year is negative. The social landscape is so vast and diffuse that formal institutional structures have almost no organizing power; friendships fragment into voluntary, niche communities operating independently of the university's administrative categories.
V. Validation
Comparison with Traud et al. (2012)
| ERGM Term | This Study | Traud et al. |
|---|---|---|
| edges | ||
| nodematch(residence) | ||
| nodematch(year) | ||
| nodematch(major) | ||
| nodematch(high\_school) |
Both models agree on the dominance of residence and year. The sign flip on high school ( vs. ) is attributable to model specification: their model included a `gwesp` term for triadic closure, which explicitly accounts for endogenous clustering. By absorbing the "friend of a friend" effect into a dedicated structural term, their model leaves a residual positive high-school signal. My more parsimonious model, lacking a triangle term, allows the strong residence and year coefficients to explain away and invert the high-school effect. It's an evidence that on-campus affiliations at Caltech are powerful enough to overwrite pre-college ties entirely. The less negative edges term in my model ( vs. ) is consistent with this as without `gwesp`, some ambient clustering is absorbed into the intercept.
Dartmouth Sensitivity Analysis
To check whether Dartmouth's results were an artifact of non-undergraduate nodes (grad students, faculty, alumni), I constructed an undergraduate-only subgraph by filtering to class years 2005--2009 and extracting the largest connected component.
| Measure | Full Network | Undergrad LCC |
|---|---|---|
| 7,677 | 4,852 | |
| 304,065 | 213,593 | |
| Density | 0.010 | 0.018 |
| 79.2 | 88.0 | |
| Clustering | 0.151 | 0.167 |
| Assortativity (residence) | 0.118 | 0.126 |
| Modularity | 0.431 | 0.445 |
| 2.768 | 2.533 | |
| Diameter | 8 | 6 |
Removing ~3,000 non-undergraduate nodes sharpens every metric. Density nearly doubles, average degree rises from 79 to 88, clustering increases, and the network becomes topologically tighter ( drops, diameter shrinks from 8 to 6). The "Social Bubble" signatures are more pronounced in the core undergraduate population; the full-network ERGM was absorbing noise from peripheral nodes.
Subgroup Analysis: Class Year Dynamics
A Mann-Whitney test compared degree centrality distributions between the Class of 2008 (freshmen, ) and the Class of 2005 (seniors, ).
| Class Year | Median Degree | Mean Degree | SD | |
|---|---|---|---|---|
| Freshmen (2008) | 1,079 | 59.0 | 77.7 | 76.0 |
| Seniors (2005) | 1,009 | 66.0 | 79.6 | 71.0 |
Result: , (not significant). Social embeddedness at Dartmouth does not stratify by class year. This is consistent with a close-knit environment where cross-cohort interaction is the norm and networks mature quickly, and even first-years reach connectivity levels comparable to seniors.